Monday, December 12, 2011

LEED

Leadership in Energy and Environmental Design
  • LEED is a green building certification. 
  • Innovative ways to construct or  renovate buildings 
  • Reduce the carbon footprint left behind 
  • Provides guidelines and standards throughout the design, construction, operations and maintenance  phases.
Why LEED?
  • Reduced carbon footprint
  • Lower operating costs
  • Conserve energy and water
  • Improves the overall performance and quality of a building
How it Works?
LEED operates on a points rating system for a building split up into 5 main categories.

Sustainable Sites
  • Site selection and development. 
  • Points are awarded for: 
  • Preserving the land and its surrounding ecosystems 
  • Reducing local heat effects to erosion

Water Efficiency
  • Encourages a reduction in the use of water. 
  • Outside:- Irrigation and rain harvesting systems. 
  • Inside:- High efficiency appliances and fittings.

Energy & Atmosphere
  • Most important section, and is weighted appropriately. 
  • It is most important because it focuses on reducing energy consumption. 
  • This can be achieved in a great number of ways, all aimed at reducing the overall energy consumption of the building, thus reducing its carbon footprint.

Materials & Resources
  • Reducing waste. 
  • This applies primarily to the construction and operation 
  • Dependent on the materials used for everything from framing to flooring.
  • Economically preferable products 
    • Recycled 
    • Low emissions 
    • Extracted, processed and manufactured within 500 miles.

Indoor Environmental Quality
  • Improve living conditions within the house
  • Smaller impact on the outside world around it
  • This includes better air quality indoors through the use of 
    • Moisture control 
    • Ventilation 
    • Air Filtering
Bonus Points are also available from:
Innovation in Design
Locations and Linkages
Awareness & Education

ENERGY STAR

LEED strongly encourages the use of ENERGY STAR rated products in the home. This can range from lighting to high efficiency appliances.

In 2010 Americans who used ENERGY STAR products helped saved enough energy to avoid greenhouse gas emissions equivalent to 33 million cars in 2010 while also saving $18 billion on utility bills.

Gold Certification Results

Costs and Impact of a LEED Home


Sunday, December 11, 2011

System Design

Maximum qsupply is in December: 11,000 Btu/hour
COP = 4.3
Max pump work = 2,600 Btu/hour

Tout = 38.5 degrees F
Tin = 42 degrees F

UA-pipe = 891
Rs = .7226/Length
Rp = .1571/Length
Rw = .01533/Length

Pipe Length = 800 Feet


Payback Time:
Capital Cost = $3,080
Fuel difference = $220/year

Simple Payback Time = 14.5 years

Feasibility

Three possible designs: Wind Power, Solar Power, Geothermal

Wind Map over Boulder, Colorado:

Solar Radiation Map over Boulder, Colorado:


Geothermal:
Ground temperature = 50 degrees F

Sunday, October 30, 2011

Home energy

For a 1000 square foot home with 8 foot ceiling, we assumed the wall was made of bevel wood siding, polywood sheething, 3 1/2" fiberglass batt, 3 1/2" wood studs, 1/2" drywall, and 15% stud contribution to 85% cavity contribution. We also assumed that there were 14  air exchanges per hour. Using these assumptions, the values we got for a home in Boulder, CO are:

Rsiding=.8;
Routerins=.63;
Rinnerins=13;
Rstud=4.38;
Rdrywall=.45;
Riair=.68;
Roair=.17;
Rshingles=.44;
Rattic=3.1

Rwall = 13.3
Rceiling = 16.8
UA = 2.78
ma = 1498 lb/hr
cpa = 0.24 BTU/(lb °F)

JAN
FEB
MAR
APR
MAY
JUN
34.54
35.87
42.51
48.63
57.59
65.98
JUL
AUG
SEP
OCT
NOV
DEC
73.54
70.89
62.88
51.34
41.78
34.08

Heating degree days:5320
Cooling degreedays:476

Qh = 1,927,000 BTU/year
Qc = 172,700 BTU/year

Monday, October 24, 2011

LEED Quality Homes

LEED is the Leadership in Energy and Environmental Design, a green building certification system that is internationally recognized. LEED provides ways to identify and implement measurable and practical ways for people to design, build, operate, and maintain green buildings.

LEED has multiple rating systems for projects, which is based on an open, consensus based process. They type of rating system used is depends on the type of construction being done. Volunteers from the building and construction industry make up a committee which leads the process. Some of the things LEED ratings are based on include water efficiency, energy efficiency, location sustainability, what materials and resources are used, and awareness or usage of the buildings green capabilities.

Some of the different categories or profiles that LEED provides to chose from are new construction, existing buildings, commercial interiors, core and shell, schools, homes, retail, and neighborhood development. If a project seems appropriate for more than one category, they have a 40/60 rule to determine which category to use. To determine which is more appropriate, LEED recommends assigning every square foot to one of the categories, and then using the resulting percentages to determine which is most appropriate. If a catergory has 60% or more, then that is the recommended category. If the categories are between 40% and 60%, it is up to the projects lead designer which category to use.

One of the profiles is a core-and-shell project, which could be a bit ambiguous. Generally, a core-and-shell project consists of base building elementssuch as the structure, envelope and building-level systems, such as central HVAC, etc.


One example of a LEED-certified project is the Medium Tactical Equipment Maintenance Facility at the Joint Base Lewis-McChord, W.A. The facility is labeled as a new construction profile, and has a Gold rating of 45/60 points. The individual ratings are 10/14 for site sustainability, 5/5 for water efficiency, 11/17 for energy and atmosphere, 5/13 for materials and resources, 10/15 for indoor environment quality, and 4/5 for innovation and design. Since 2006, all military buildings must achieve at least a silver rating from LEED in an effort to reduce excess water and energy usage and waste production. 

Monday, October 3, 2011

Hong Kong End Uses

Comparison Summary

Wind power essentially has no cost for fuel, but has a high cost of production per kWh it can produce as well as a low energy capacity. It is also limited to the main areas of the wind stream for fully effective use. Wind farms also require a large amount of land dedication, whether they are on land or offshore turbines. Wind power has essentially no waste production, greenhouse or otherwise.


Natural gas has the second highest cost of production per kWh, with solar being the most expensive. It has a cost of energy production comparable to petroleum. Natural gas would use about the same amount of land as coal or nuclear, as it would need a standard power plant to burn the gas. Natural gas also has waste gas production, although it is much lower than coal or petroleum.

Coal is currently the largest producer of energy, because it is cheap and has a decent energy density. However, the impact it is having on the environment is cause for concern. Greenhouse gases as well as the effect of mining make it necessary to be phased out of use. Coal is a fossil fuel, meaning there is finite amount of fuel reserves, which are predicted to be depleted in less than 100 years. 


Petroleum has production cost similar to coal, and has the same problem of greenhouse gas emissions, although to a lesser degree. It also has a relatively high energy density compared to other forms of energy production. Petroleum uses power plants, so the land use is the same as coal as well. It is also a fossil fuel like coal, so there is a finite amount of fuel reserves. 

Nuclear power has very many advantages to it. It’s cost of electricity production is on par with the cost from coal, which is considered one of the cheapest methods of production. Nuclear has by far the best energy density and capacity factor compared to the other methods of energy production, nearly two million times more than that of coal! It has a very low to no greenhouse gas emission, but the toxic waste it produces still does not have a great means of disposal. 

Biofuels use waste from other products, so it has a much cheaper cost of fuel. It also means that there is not a finite limit to how much fuel is available. It uses power plants like many others, so the land use is comparable to current coal power plant land use. Biofuels have a lower energy density than other methods as well. There is very little waste produced compared to burning coal or petroleum.

Solar has no fuel cost either, but has a huge production cost per kWh. It is still a very inefficient power source as well, with the best converters at about 20% efficiency. The solar panels are still very expensive to produce as well as maintain, which is the largest obstacle preventing more solar energy production. Because there is no fuel being used, solar energy is extremely clean. Depending on implementation, solar power can have a large or small land area usage. If made into PV farms, they would use a lot of land area. However, if they are installed in places such as rooftops, house sidings, etc. they would use very little land area. Another problem with solar is the unpredictability of sources, as the solar radiation depends on time of year, cloud cover, time of day, etc. 

CO2 Due To Biomass Reduction

The reduction in biomass( deforestation) has a definite effect on the overall CO2 levels in the atmosphere. Trees and other biomass act as a CO2 sink and absorb the atmospheric CO2. However, in terms of the overall CO2 levels in the atmosphere   the biggest cause is humans burning fossil fuels. “deforestation and forest degradation emissions contribute about 12% of total anthropogenic CO2 emissions”

http://www.biology.duke.edu/jackson/ng09.pdf

Energy in An Apple

The amount of energy that is inherent in an apple truly depends on where it is grown. The transportation and storage of an apple out of season is nearly 3 times as much energy than it is to grow it. We assumed the average weight of an apple is 0.5 pounds. We also assumed that in season you can get an apple grown and transported around 100km away. First, the amount of energy to grow an apple was found. This was found to be approximately 0.5 kWh. Then using data already calculated, we assumed it is 0.8kWh/ton-km to transport an apple. Using these numbers, an apple grown within 100km has 0.54 kWh of inherent energy, while an apple that is out of season, and has to be shipped in uses 1.7kWh. This may not seem like very much but if you increase the amount of apples from one to several million, the number can become rather frightening.


http://userwww.sfsu.edu/~cholette/sustain/SSCpublic/Local_vs._Imported_Apples-case3.pdf

Final Green Stack vs. Red Stack

Green Stack: Geothermal

Unfortunately for Hong Kong, geothermal energy is another unfeasible source of renewable energy. Due to geological constraints and such a dense population, geothermal energy is a renewable source that would not work in Hong Kong. Assuming hot dry rock resource was similar to the UK as presented in McKay's book, "Sustainable Energy Without The Hot Air", The UK has a population of only about 43 people per km^2, while Hong Kong has about 6250 people per km^2. The UK presented only 0.13 kWh/day per person with a much less dense population, revealing little hope for Hong Kong. In addition when conducting research, every site stated that geothermal energy is not plausible for Hong Kong.

Green Stack: Wind

Unknown to many, wind is actually a form of solar energy. Wind is caused by not only the varying contours of the Earth but also from the infared radiation given off by the Sun and Earth. Air in different locations across the Earth are heated differently due to these factors. This leads to areas of colder and thus more dense air pockets, as well as less dense and warmer areas. The air flows from areas of higher pressure to low pressure, and is directed differently due to the  varying pressures as well as other factors mentioned. This wind can be harvested into energy through the use of wind turbines. The kinetic energy in the wind is converted into electricity as the wind turns the blades of a turbine, powering an electric generator. This power is considered a renewable energy source because wind is an infinite power source (it will never run out). As with all energy sources however, it has its drawbacks. One such drawback is that they are often best placed in remote locations away from cities and other areas with high energy demand. Another disadvantage is the initial investments to create a wind turbine farm are considerably expensive compared to other energy sources.

To estimate the amount of kWh/day of energy could be created using wind turbines in Hong Kong, the power per Unit Area of Land first needs to be calculated using the equation (pi/400)*pv^3. With an average temperature of 23 degrees C in Hong Kong, the air density is about 1.2 kg*m^-3. The average wind velocity is 3.32 m/s. Inserting these values into the above equation reveals a Power per Unit of Land of 0.34 W/m^2. The average wind speeds in Hong Kong varies from 0.15 to 6.49 m/s.The Area per person in Hong Kong calculates out to be: 1104 km^2 / 6.9 million people = 160 m^2 per person. The power per person then is 0.34 W/m^2 * 160 m^2 = 54.4 W per person. Multiplying this by 24 hours per day gives 1.3056 kWh/person. Assuming 15% of the land could be used for wind turbines, a total of 0.2 kWh/day of available energy from wind turbines.

Green Stack: Hydroelectricity

 In order to be able to generate hydroelectic power, two main features are required for a country: elevation above sea level and rainfall.
With a population of approximately 6.9 million people, Hong Kong's potential Hydroelectric power capabilities come out to be too insignificant to even consider, being about 0 kWh/day. This number is derived by taking into consideration the average rainfall in Hong Kong of 2382.7 mm per year. This along with the density of water (1000kg/m^3),  and the strength of gravity being 9.81 m/s. The average altitude above sea level across Hong Kong is only 33 m. With such a large population, and such a small elevation, Hydroelectric power becomes an unfeasible solution.

Sunday, October 2, 2011

Wave Energy

Using similar figures as McKay, we found meters of shoreline along with the average amount of energy a wave has per meter of height. We then estimated that only about 25% of the waves actual energy would be able to be harvested. This is due to loses in the turbines as well a an inability to catch an entire wave.

Energy Consumption: Stuff and transporting stuff

In order to find the energy consumption per person per day in kWh, in terms of "Stuff" all items had to be considered. Things that seem not to fit in other categories go into the "Stuff" category. We decided on a few of the items that would use more energy and that are in nearly every household. With that in mind we decided to account for miles of road, computers, cars, cluminum usage, and plastic bottles. For transporting stuff, we found the average amount of energy consumed per ton of cargo according to McKay. Then we simply found out the amount of stuff was is being transported into and out of Hong Kong.

Tuesday, September 27, 2011

Offshore Wind Energy

One possibility being developed with wind energy is placing the wind turbines out in the ocean shore, where they are not invasive to property and the wind speeds are greater. The wind speeds around Hong Kong's shores are about 6 m/s at 60 m height. Turbine power is related to the cube of the wind speed, so to account for the greater power from higher occasional velocites we use an effective velocity of 7.5 m/s. The wind turbines are usually placed at 100 m height, and the increased height will cause the turbine to see an even higher velocity. To find this velocity we use the equation V=7.5*(100/60)^(1/7). This yields a velocity of 8.1 m/s seen by the turbine. The power produced by the turbine is Pi/400*(density)*(V)^3. Using the calculated velocity and standard density of air, we get a turbine producing 4.82 W/m2. If we then assume that they can be placed up to 10 km offshore over a third of the coastline, and using a coastline distance of 7330 km, we get a total turbine power of 41 kWh per day per person for Hong Kong.

Offshore wind turbines have two different structures, which are separated by whether they are shallow offshore or deep offshore. It is useful to separate these because the difficulty of maintaing deep offshore turbines. Approximately 1/3 of the area described above is shallow water, so for shallow offshore power we get 13.7 kWh per day per person, and 27.3 kWh per day per person for deep offshore power.

Solar Energy Possibility

A commonly talked about renewable energy source is solar energy, or the energy released from the sun. Above Hong Kong, the solar radiation is approximately 200 W/m^2. There are 3 main ways that this energy can be used: direct heating, PV cells, and creating PV cell farms. We will assume each person is allowed 10 square meters for the different approaches.

For thermal heating, we assume that the heaters are 50% efficient at making hot water. So 50%*10 m2*200 W/m2*24/1000 kWh/W yields 24 kWh per day per person for heating.

For electrical power, we will give everybody a 15% efficient PV converter. More expensive ones could get up to 20% efficient, and cheaper ones can be as low as 10%, so we are taking the median of those for mass production. We then get 15%*10 m2*200 W/m2*.024 kWh/W yielding 7.5 kWh per day per person.

The PV cells could theoretically be put into farms as well. If we assume that 10% of the land area (11.04 km2) can be made into a PV farm, then each person would get about 16 m2. We also assume that because these will be mass produced that the cheapest panels will be used which are 10% efficient. So we take 16 m2*10%*200*.024 kWh/W yields about 8 kWh per day per person produced. This is much lower than other countries due to the fact that so much of Hong Kong is city.

Energy Consumption: Food

People obtain the energy they have through the consumption of food. However, how much energy does it take to produce the food we are consuming?

Milk/dairy:
A typical dairy cow produces 16 litres of milk per day. If we assume that the average person drinks one pint of milk and uses 50g of cheese (equivilent to 450g of milk) for cooking, than each person needs 1/16 of a cow every day. Assuming a cow weighs 450 kg and has similar energy requirements as a person, it consumes about 21 kWh/day. So 1/16 of that means each person consumes about 1.5 kWh per day for dairy (McKay).

Eggs:
We will assume that a person eats an average of 2 eggs per day for breakfast. An egg-producing chicken eats about 110 g per day, which translates to 0.4 kWh per day if we assume the same ratio of energy to kg as people. If an average egg-laying chicken lays about 290 eggs per year, then eating the 2 eggs in the morning is equivilant to 1 kWh per day (McKay).

Meat:
In Hong Kong, the average person eats 365.2 kg of meat per day. Assuming that this meat is of equal amounts of chicken, pork, and beef, then each person is using about 13 lbs of chicken, 107 lbs of pork, and 268 lbs of beef. This is a total of about 280 kg of animal meat. If we multiply by our conversion of 3 kWh/day per 65 kg, this gives us a total of 12.8 kWh per day.

Farming and Fertilizer usage are negligible in Hong Kong, because less than 8% of the land area is used for farming. Hong Kong is essentially an entire city. So when we total the usage of all the food and farming kWh's, we get a total of about 16 kWh per day per person.

Tuesday, September 6, 2011

Energy Consumption: Cars

To determine the average kWh a person in Hong Kong uses each day by car transportation, the amount of motor gasoline used per person is found as 325,000 tons. The population of Hong Kong is about 6.9 million people. By dividing and using the conversion of 31.75 gallons per ton and 3.79 liters per gallon we obtain liters of gas used per person. We can then use the same assumption as McKay of 10 kWh per liter.
After the above calculations, we get an average of 57 kWh per person.

Source: http://www.nationmaster.com/graph/ene_mot_gas_con_in_roa_tra-motor-gasoline-consumption-road-transport

Energy Consumption: Airplanes

To find the kWh used flying in Hong Kong per person per day, first the amount of passengers from Hong Kong airports per years was found to be 20,010,000 passengers/year. Then the average flight time was assumed to be 3 hours, using flights going out of Hong Kong. Like McKay, we assumed all flights were a 747 which cruises at 565 miles/hour, has a fuel economy of 0.138 miles/gallon and carries 416 passengers when full. Also using McKay's assumption of 10 kWh per litre which translates to 37.9 kWh per gallon.

Therefore:

This amount of energy usage may seem high, however there are a few reasons that could contribute to such a high number. First, the amount of airline passengers per capita (1) is 2.9 passengers per capita, this is the 13th highest around the world. Also, many of the passengers going to and from Hong Kong would be business related, therefore while still using Hong Kong's resources, they are not included in the per capita count.


(1) http://www.nationmaster.com/graph/tra_air_tra_pas_car_percap-transport-passengers-carried-per-capita

Heating and Cooling Homes In Hong Kong

Heating and cooling are amongst the biggest energy consumption sources throughout the world. The reason is simple; air conditioning and heating have no longer become a luxury in many cities throughout the world, but a necessity. Hong Kong holds true to this instance. September 29th, 2010 Hong Kong attempted to have their first “No Air Conditioning Night.” 50,000 households did their best, while the other 2,285,000 homes didn’t have the dedication to turn a/c units off. Air conditioning has become so large that during the summer months, air conditioning contributes to 60% of the total energy  consumption.
The average home size in Hong Kong is only 600 ft2 and generally houses 2.9 people per household. With an average ceiling height of 8’, each person in Hong Kong contributes to 1600 ft3 of heating  and cooling their homes. The average temperature during the 6 colder months is 66° F, and 81.8° F in the warmer 6 months. Through a simple calculation, the total energy consumed for cooling can be found. Air has a density of 0.08lb/ft3, and has a specific heat of 0.241 BTU/Lb*F.  Applying the formula Q=m*Cp*∆T, a rough estimate for the energy consumed by a Hong Kong resident for warming/cooling their homes can be calculated. Assuming an air conditioner is circulating the air throughout the house in 0.5 hours, 6144 lbs. of air needs to be cooled per day per person. Applying these values to our formula and assuming households are set to remain at 70°F we get:
Qcool=6144*0.214*(81.8-70)=15514.8 BTU.
15514.8 BTU = 4.54694 kWh/day for cooling.
For heating the house up to 70°F,
Qheat=6144*0.214*(70-66)=5259 BTU.
5259 BTU = 1.54 kWh/day for heating.


Additional heating and cooling arises from other applications such as hot water for baths, showers, cleaning, etc., refridgeration purposes, and for cooking. The kW/day per person for these applications were found using the number of Terajoules used in each of these sections as provided in the "Hong Kong Energy End-use Data 2010" published by EMSD (Electrical and Mechanical Services Department).  Refridgeration came out to 2.51 kW/day per person, 4.26 kW/day per person for hot water, and 7.26 kW/day per person for cooking.


Taking all calculations into consideration, the total energy used for heating and cooling in Hong Kong comes out to about 20.1 kW/day per person.


Red Stack Vs. Green Stack

When analyzing the energy consumption of a country and determining how much each item contributes, it is helpful to utilize the Red Stack Vs. Green Stack technique. The red stack represents the summation of energy consumption. This stack is generally split up into energy consumption used for transportation, heating and cooling, lighting, information systems, food, and manufacturing. The green stack is a breakdown of sustainable energy production such as wind, solar, hydroelectric, etc. The purpose of putting these stacks next to each other is to answer the question, “Can we live on sustainable energy sources?” An example of how this completed breakdown will look is displayed below. Here David JC MacKay broke down energy consumption and sustainable energy for the UK. We will be going through and doing the same breakdown for Hong Kong, to see what the chances are of Hong Kong being able to run purely on sustainable energy sources.

Steam engines and other sources of greenhouse gases

The steam engine is considered to be one of the most important influences in the industrial revolution. This steam engine revolutionized not only industry but transportation as well. Before this engine, the emissions from human production were almost at practically nothing. However, after the new steam engine was created there is a visible jump in CO2 concentration in the atmosphere.  Steam engines are generally are generally heated by coal, which produces about 2.86 tons of CO2 per ton burned (1).  With the steam engine fueling the Industrial Revolution, human emissions have been steadily growing due to a better ability to produce and an insatiable appetite for more. The different amounts of greenhouse gas that transportation, industry, residential and commercial give off in Hong Kong can be seen on the piechart breakdown below. 

Is Energy Important?

Energy is necessary for our everyday lives. Energy is used for everything from heating water to running our cars. A large portion of this energy is powered by fossil fuels. Different economies use different amounts of energy, and in different areas. These fluctuations can be due to geographical differences, differing cultures, and varying technologies amongst other things. The energy use breakdown for Hong Kong can be seen in the figure below, as discovered by the Electrical and Mechanical Services Department (EMSD).
A more detailed breakdown by the different areas that use this consumption and what it is being used for can be seen below. Figures such as these prove to be important because it shows which areas are consuming the most energy, thus revealing which are areas that need to be focused on for reducing energy consumption.

The Greenhouse Effect For Dummies

One of the most problematic side effects of fossil fuels is the lasting effect it has on our planets ecosystem, commonly referred to as the greenhouse effect. This is a natural effect that arises from the planets absorption of thermal radiation given off by the sun. The sun emits solar radiation that passes through the earth’s atmosphere. Naturally some of this radiation is absorbed into the Earth, giving a warming effect, while other is reflected off. Greenhouse gasses play a significant role throughout this process because they also absorb some of the sun’s radiation, and then emit the radiation back into the Earth’s atmosphere.  The Image below provides a visual representation of this effect.

The highest contributor to this greenhouse effect is Carbon Dioxide which is given off from the use of fossil fuels. Currently, with the burning of such large quantities of fossil fuels, more and more of these greenhouse gases are building up in the atmosphere. This results in additional radiation being re-emitted back to the Earth, providing a warming effect. Hence, the Greenhouse effect. In Hong Kong specifically, CO2 is the overwhelming Green House Gas that is being emmited, as can be seen in the figure below.

The effects on the environment without changing the current energy profile

The current energy consumption profile is shown on the figure below. 80.3% of the energy produced in the World is fossil fuel. Fossil fuels are non-renewable and will eventually run out. Also, since fossil fuels are carbon based, when burned CO2 is released into the atmosphere.  The technology available today should be used to create more efficient ways of obtaining renewable energy, rather than better methods of fossil fuel extraction.  Increasing renewable energy usage will cut down on CO2 in the atmosphere, thereby reducing the greenhouse effect. Without changing the current energy usage profile, CO2 will continue to be pumped into the atmosphere at an unsustainable rate, thus increasing the temperature of the planet. This affect, although it sounds relatively harmless, can wipeout coastal cities and have devastasting effects on marine life.


Figure :  http://www.personal.psu.edu/kdh5039/Assignment6/Assignment6.html

The Three Components of Sustainability

                            
The ability to meet the needs of the present generation, while not compromising the ability to meet future generations’ needs.  Social, Ecological, and Economic were deemed “The Three Pillars” of sustainability at the 2005 World Summit.  In order to be sustainable, all three requirements must be met. If something is using very little resources and is socially acceptable but not affordable, clearly it can not be considered sustainable. The figure above shows the different ways resources can be used and what is considered sustainable.

Monday, September 5, 2011

What else affects the Earth's climate?

Because there are so many other factors that affect the climate other than human actions, it can be beneficial to group them based on whether they help warm or cool the Earth. These factors are also known as "forcings." If a forcing helps warm the Earth, it is a positive forcing. This includes things such as solar flares and sun spots, volcanic activity, and the release of greenhouse gases into the atmosphere such as the burning of fossil fuels. A negative forcing then helps cool the Earth. One of the major negative forcings is the polar ice caps, which reflect a lot of solar radiation back towards space. As the Earth continues to warm, the ice caps are beginning to melt and break apart, increasing how quickly the Earth warms. Other negative forcings include actions that decrease the concentration of Greenhouse gases in the atmosphere, such as reforestation. The new plants take CO2 out of the atmosphere and return oxygen. A major factor is the Earth's albedo, or how well it reflects solar emissions. With the melting of the ice caps, the Earth's overall albedo is decreasing, allowing the Earth to warm at an increasing rate.

What proof is there that humans are the cause?

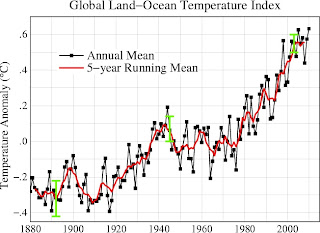
Some skeptics may ask for scientific proof that human activities are causing the increase in global average temperatures, and not natural effects. As shown in figures 1 and 2, the global average temperature and CO2 emissions begin to take off around 1900-1910. When compared to levels from the past obtained by ice sampling, tree-ring analysis, and other methods, it can be seen in figure 2 that in the past 100 years, changes have occurred that normally would take hundreds of thousands of years, and corresponds to when the the industrial revolution took place. The concentration of CO2 in the atmosphere is nearly 30% higher than has ever been  seen in history. This evidence leads to the conclusion that natural causes cannot have caused these kinds of changes so rapidly.
Figure 1

Figure 6—Variations in carbon dioxide concentrations in the Earth’s atmosphere over the last 400,000 years. Source: Robert A. Rohde and Global Warming Art.
Figure 2

Figure 3
Figure 3 shows the temperature variation with the CO2 variation from the past 800 thousand years obtained by ice core sampling. The data shows that a change of 100 parts per million (0.01%) of carbon dioxide concentration corresponds with a change of 10 degrees Celsius in average global temperature. Today's high concentration of carbon dioxide (highest ever recorded in over 800 thousand years) will undoubtedly cause drastic changes unless something changes. They also show that human activity causing increases in the carbon dioxide levels, such as the burning of fossil fuels, is causing irreversible changes to the Earth's climate.

Why is the Earth's temperature increasing?

The Earth's temperatures have been slowly increasing due to the Greenhouse effect. When solar radiation reaches the Earth, it is able to pass through the atmosphere because of it is high frequency radiation. Some of this radiation is then reflected back towards space at a lower frequency. Greenhouse gases, such as carbon dioxide and methane, in the atmosphere trap the low frequency emissions, and release them in random directions. As more Greenhouse gases are put into the atmosphere, less of the reflected heat from the sun is able to get to space, so the Earth gets warmer and warmer.
The ability of a greenhouse gas to trap heat over a certain amount of time is measured as it is compared to carbon dioxide. This is known as the Global Warming Potential of the gas. For example, methane has a 20 year GWP of 72. This means that if equal weights of carbon dioxide and methane were put into the atmosphere, over 20 years the methane would trap 72 times the amount of heat as carbon dioxide. Although carbon dioxide does not warm the earth as much, it is the largest percentage of the atmosphere. Carbon dioxide also is the gas with the most emissions from human activities such as the burning of fossil fuels. This is why when talking about global warming carbon dioxide is the gas most talked about.

Sunday, August 28, 2011

Why Should We Think About Energy?

The answer is simple. We should think about energy because our main sources of energy are running out. Currently the world is powered through the use of various fossil fuels. It is common knowledge that these energy sources will not last forever, which means efficient alternative energy sources will need to be developed. In addition to the limited supply, fossil fuels are detrimental to our planet. The resulting climate changes due to our world's current use of these fossil fuels will prove to change the way of life for future generations.

The purpose of this blog is to discuss current energy sources and the lasting effects we are currently leaving on the earth. Issues such as effects of climate change will be broken down and discussed, revealing why it is so important for us to think about energy.

What is the carrying capacity of the Earth?

The theory that the Earth can't support an ever increasing population indefinitely was first proposed in 1798 by Thomas Malthus. Scientists have dismissed this theory until recently, saying technological advancement would allow resource production to keep up with population growth. In today's energy-conscience society, scientists are beginning to reconsider their dismissal. Estimates on Earth's carrying capacity range anywhere between 2 billion and 40 billion. If the average middle-class American lifestyle was enjoyed by everyone on the planet, estimated at 3.3 times the necessary sustinace level, Earth's capacity would be about 2 billion. If, however, everyone only consumed what they needed, a limit of 40 billion seems reasonable.
The worries about the capacity of Earth come because advancing technology is not helping as predicted. This is because instead of using technology to do more things with less resources, therefore increasing the carrying capacity, technology is being used to further the way things are already being done. Consider energy production as an example. Instead of switching to things like solar energy, whose biggest faults are only money, technology is being used to find ways to extract more fossil fuels, which are non-renewable.